

A number that cannot be invented
Why the last 2% of AI errors may be harder to catch than the first 30%.
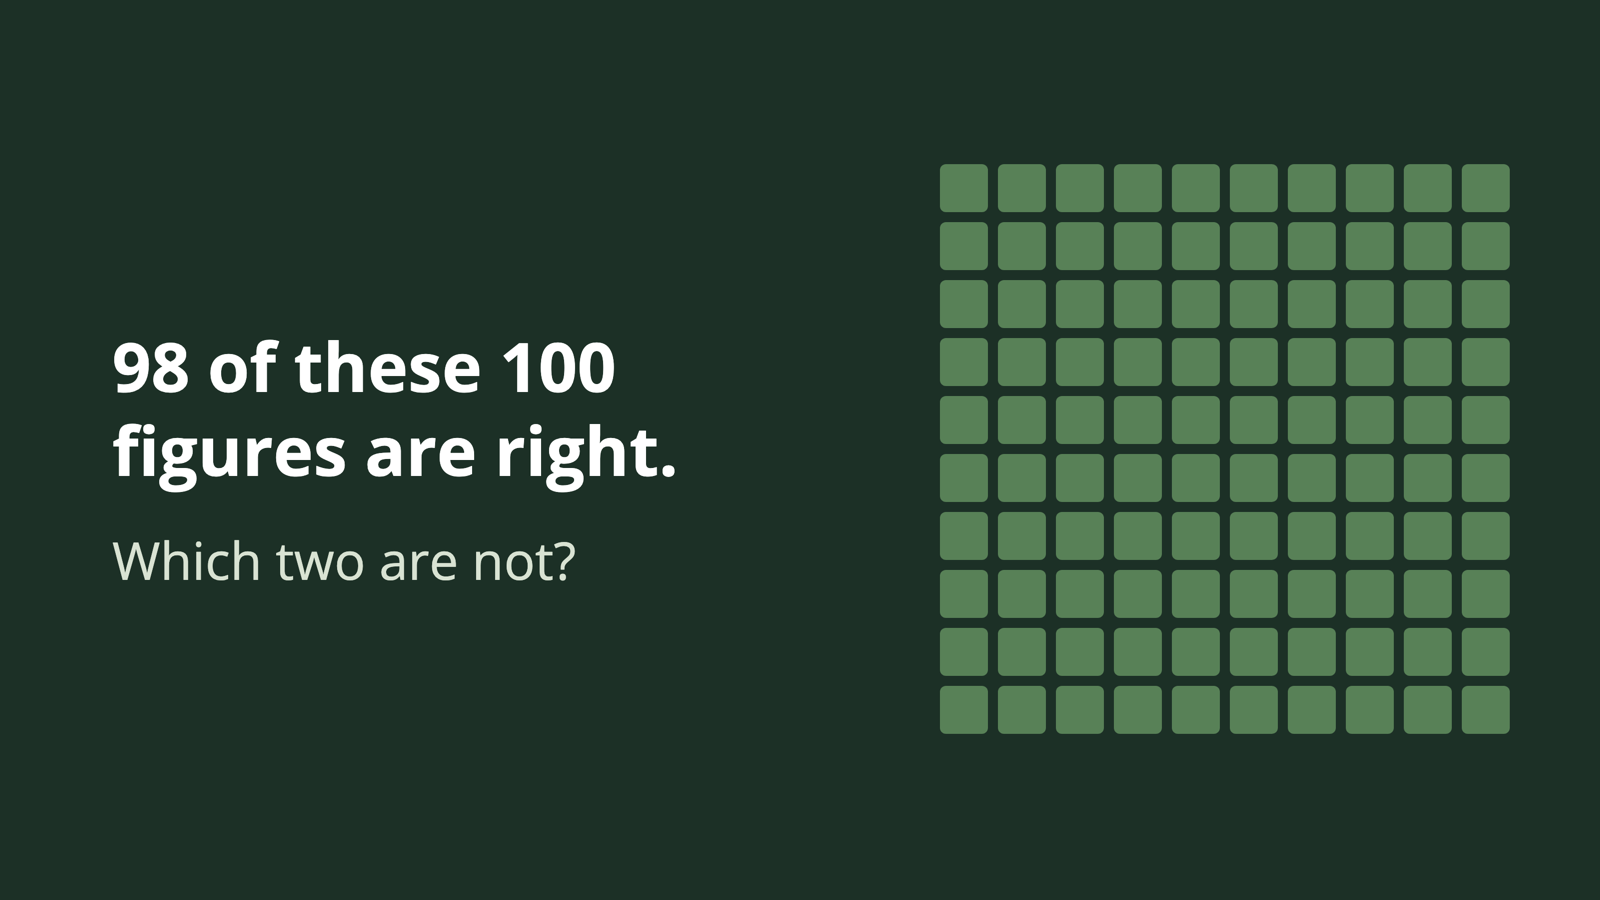
The most dangerous AI error in private markets may not be the one that happens often. It may be the one that happens after we have stopped checking.
Imagine an analyst gives an AI tool a borrower’s reporting package and asks it to fill 100 financial fields: revenue, EBITDA, net debt, leverage, liquidity, and more. In a hypothetical evaluation, 98 answers match the expected values. Two don’t.
The result is 98% accuracy. That sounds excellent. But here’s the question that matters to the investment team: Which numbers were wrong?
If the system cannot tell you, you still have two choices. Check all 100 numbers, or trust that the two mistakes will not matter. Neither is a satisfactory foundation for an institutional workflow.
The trust paradox
At 70% accuracy, nobody mistakes the output for finished work. You check it, correct it, and treat it as a useful first draft.
At 98%, the temptation is different. You have seen the tool get so many answers right that checking every answer starts to feel unnecessary. You delegate a little more. You scrutinize a little less. That’s an understandable response to a tool that genuinely saves time.
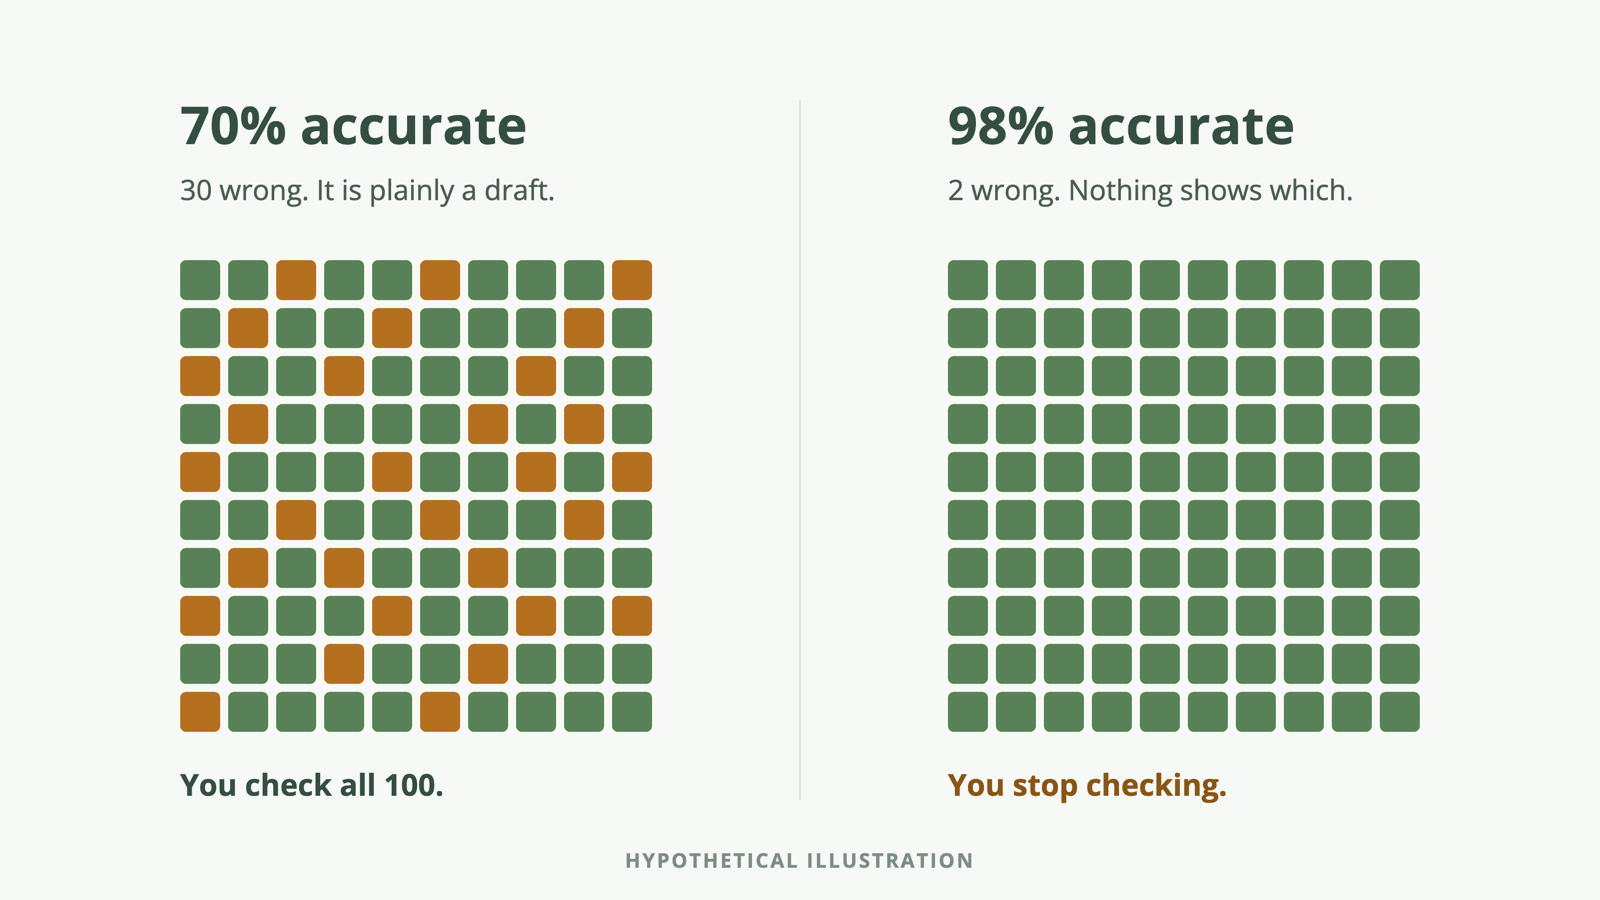
But the errors don’t announce themselves when the model becomes more capable. They become rarer, more plausible, and potentially harder to notice.
This is why I think the final 2% deserves more attention than the headline 98%. Not because every mistake is catastrophic, but because a single undetected mistake can travel a long way: from an extracted cell to an underwriting model, from the model to an investment memo, and from the memo to an investment committee discussion.
In conversations with investment professionals, we keep coming back to a version of the same concern: if verifying the answer takes as long as doing the work, what exactly have we automated? And if verification disappears altogether, who catches the exception?
The number can be real and still be wrong
When people discuss AI errors, they usually think of hallucinations: a model confidently producing a figure that doesn’t exist in the document.
That’s one failure. There’s a second, quieter one.
Suppose a borrower has an EBITDA figure in a management presentation and another in its compliance certificate. Both are real. Both may be perfectly transcribed. But one is management-adjusted EBITDA, and the other is calculated under a specific credit agreement. Or perhaps one belongs to the previous quarter.
If you ask for covenant EBITDA and the tool gives you the management figure, a citation alone does not make the answer correct.
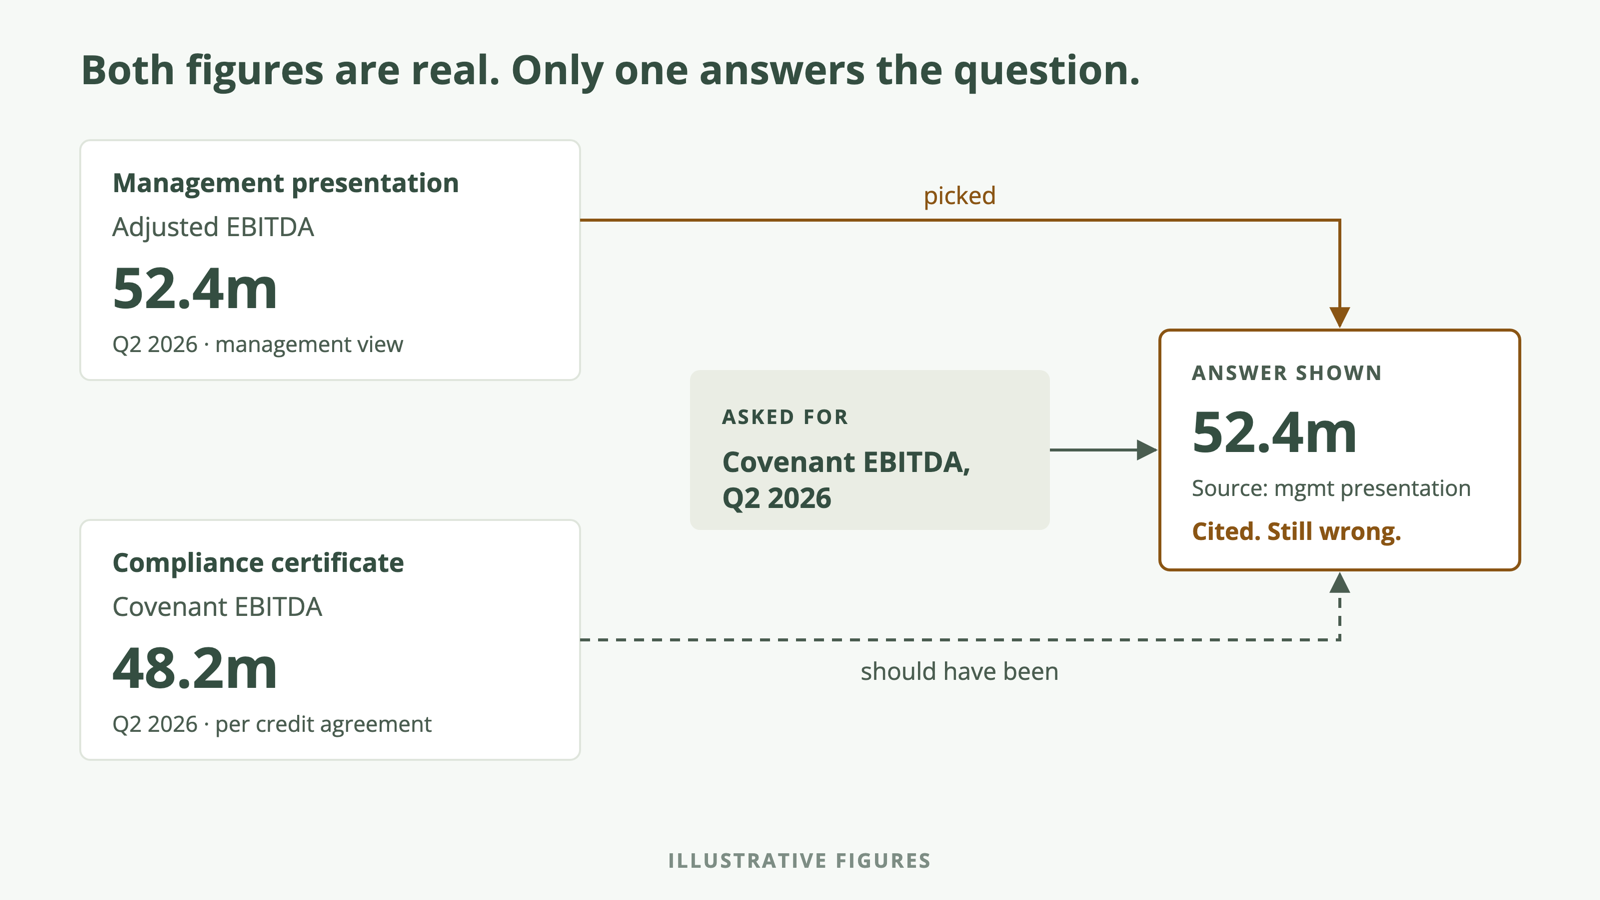
This distinction matters enormously in private markets. The relevant question is rarely just, “Can the model read this number?” It is, “Is this the right number for this borrower, this period, this definition, and this decision?”
Better models are necessary. They are not the entire architecture.
I think tools like Claude and ChatGPT have made something remarkable possible. An investment professional can explore a data room, draft a memo, analyze a spreadsheet, or even build a useful internal workflow without waiting for a software team. That changes what one person can accomplish.
But there is a difference between an impressive answer in one session and a dependable answer that an entire investment team can reuse, question, and defend.
A chat window can retrieve a figure from a document. An institution also needs to know which entity the figure belongs to, what period it covers, which document version supplied it, whether another source disagrees, and whether someone has already resolved that disagreement.
This is where I believe a knowledge graph becomes important. Not as a fashionable way to describe a pile of documents, but as a persistent record of financial facts and their relationships to borrowers, facilities, reporting periods, and original evidence.
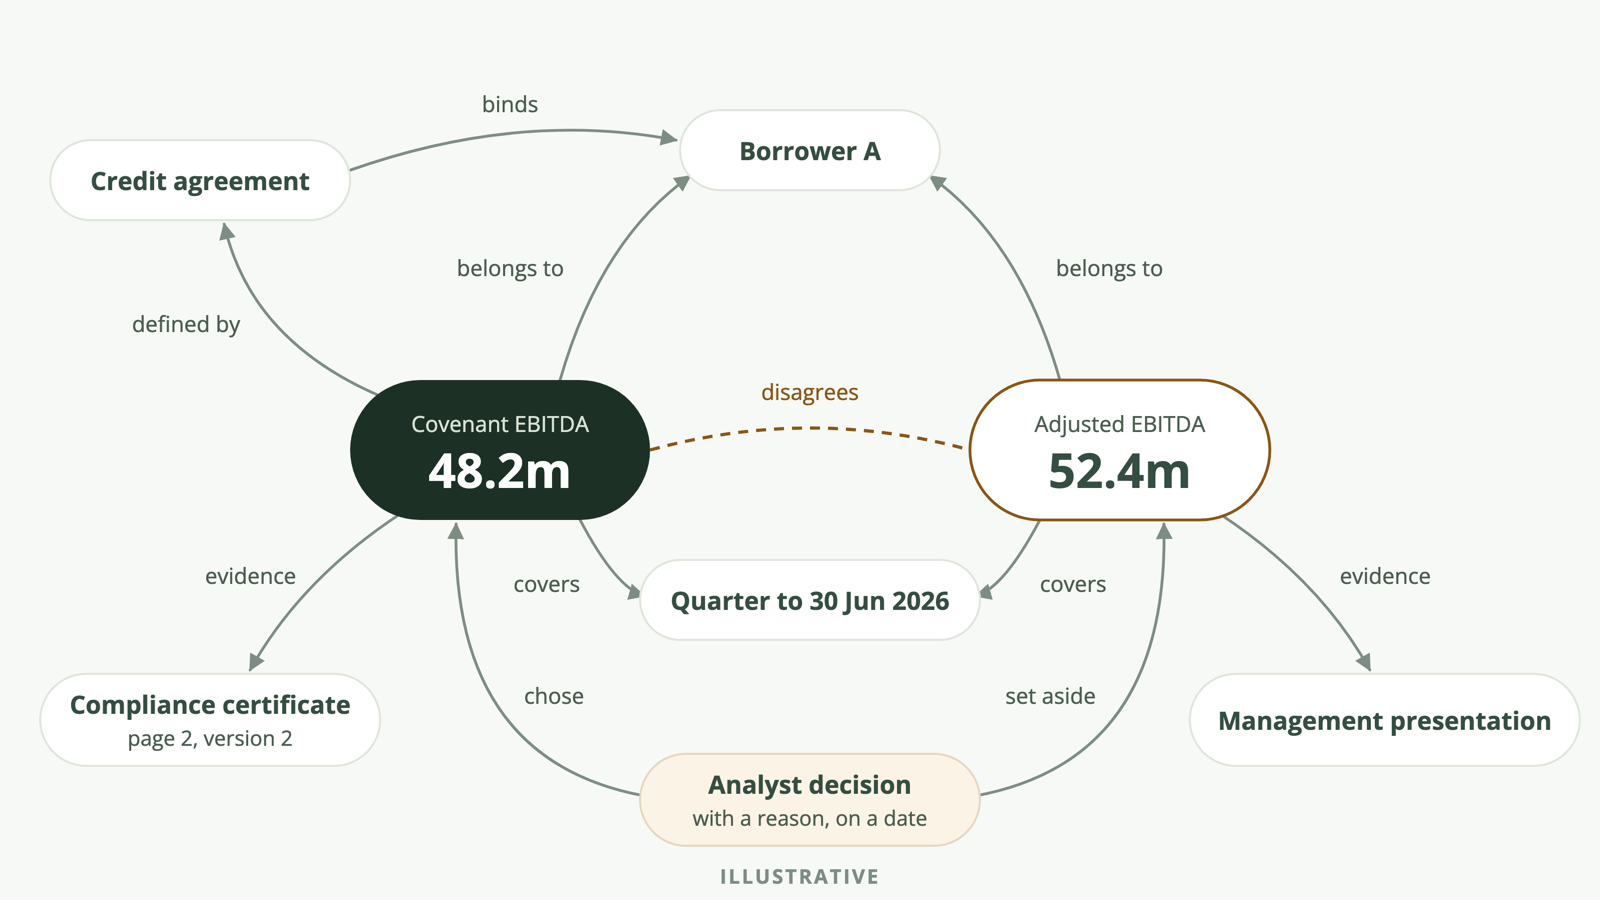
The aspiration is straightforward: an agent should not be the final authority on whether a number is true. It should be able to reason with financial facts whose origins and limitations remain visible.
A graph on its own is not a lie detector. It can preserve a wrong fact as easily as a right one. The real goal is an infrastructure layer in which facts can be traced, challenged, corrected, and reused instead of being rediscovered from scratch in every chat.
A trustworthy system should be comfortable saying “I don’t know”
I would rather see a tool leave one field unresolved than quietly fill it with a plausible number.
That isn’t an argument for accepting poor coverage. A system that refuses everything isn’t useful either. We should care about both sides of the equation:
How often can the system give a supported answer, and how often does it present a wrong or unsupported one as if it were settled?
I think that second question deserves a name: the wrong-shown rate. Not just how many answers missed a benchmark, but how many questionable numbers actually made it in front of an analyst as apparently reliable facts.
The distinction becomes especially important as models improve. A missing value is visible. A conflicting figure can be flagged and investigated. A confident but misapplied number can disappear into an otherwise excellent piece of work.
The goal shouldn’t be to remove humans from judgment. It should be to make the moments that need human judgment explicit.
What I would ask of financial AI
If I were evaluating an AI workflow for an investment team, I would ask more than whether it scored 95%, 97%, or 99% on an extraction exercise.
I would ask:
- Can I inspect the source behind a figure?
- Can I tell which reporting period and definition it belongs to?
- What happens when two documents disagree?
- What happens when the answer is not in the materials?
- Can the next analyst see the same evidence and understand why a particular value was used?
These questions sound less exciting than “fully autonomous underwriting.” But they are the questions that determine whether a helpful assistant can become dependable infrastructure.
And they suggest a larger roadmap. First, we need to know what the firm’s terms and metrics mean. Then we need an evidence-backed record of what is known. Eventually, we also need to preserve what people decided and why, so the next analysis does not start from zero.
I think of those as three connected layers: ontology for meaning, a knowledge graph for evidence, and a context graph for institutional decisions. The rest of this series will explore each one, including the difficult cases where they meet.
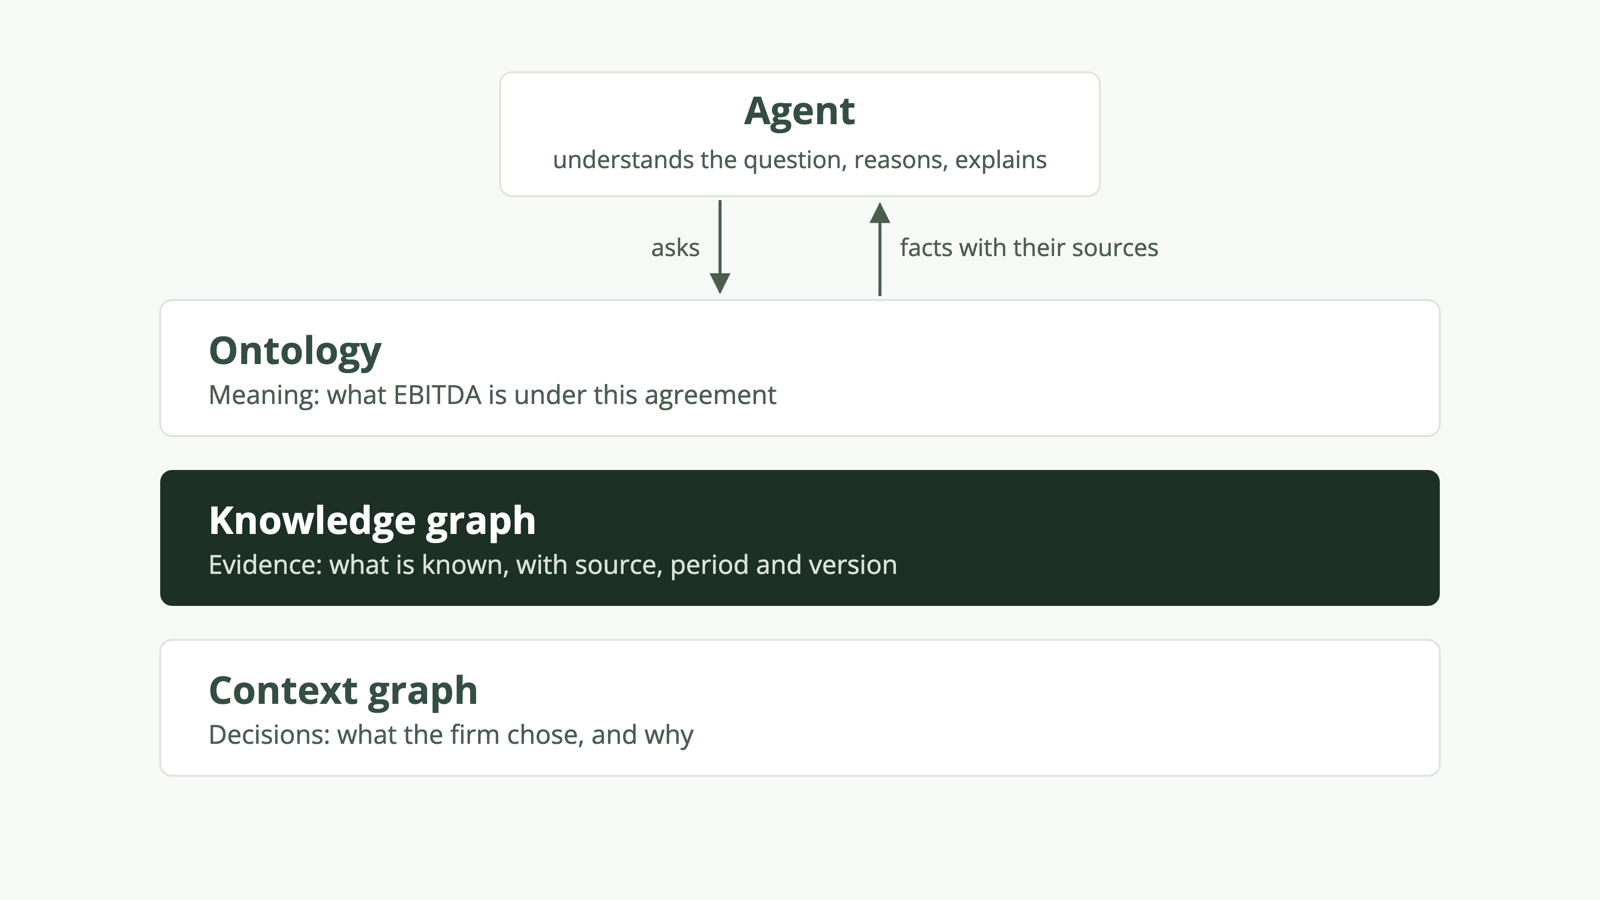
98% accuracy tells you how often an AI gets something right. It doesn’t tell you whether you can afford to stop checking.